

By Dr Amber Hammill
The Waikato Wellbeing Project has a target to reduce child poverty from 1 in 6 to fewer than 1% of children by 2030. There are no specific indicators for hunger, but the goal is that “Our children can thrive because none are hungry at school or cold at home. They can afford to participate in social, artistic, cultural and sporting activities”.
As we move towards this target, I wonder what signs, signals and indicators will we look towards to confirm what we are hearing and seeing anecdotally? How will we know, and be able to show, share and shout about our move towards a region where we are all fed, warm and thriving?
There are some signals that I think would be compelling to track as we move towards this goal, such as data relating to food grants and food bank use. They’re not perfect: we know that these are only indicators, not precise measurements, and there are all sorts of reasons they might change.
Right now, we are asking MSD to publish more data, to give us more information to help us understand food security in our region. We have made 2 requests for data via the public portal, asking for data about food grants and food banks.
Food Grant Data – applications and decisions by region
This requests asks that the Social Development Data tool be updated to include regional data on:
the number of food grant applications received
the number of food grant applications approved
the number of food grants applications declined
the number of food grant applications made by beneficiaries
the number of food grant applications made by non-beneficiaries
household composition of food grant applicants
the dollar value of food grant applications approved
A number of food banks and food rescue operations receive support from MSD. Organisations and initiatives in receipt of this support are required to report to MSD regularly on a number of measures. The request is that this data is published at national and regional levels. Specifically:
How many households are supported?
What is the make up of these households?
Number of parcels distributed?
You can ‘vote’ for these data requests by following the links Food Grant Data – applications and decisions by region and Food Bank Data and clicking the ‘vote’ button on the right hand side. The more people who join us in asking for this data the more likely we are to see it released.
It’s true that some of this data is available at various scales and in different places already.
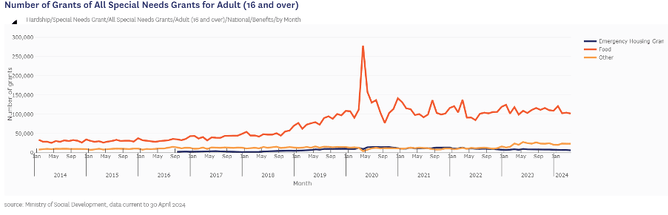
Each quarter since March 2019, MSD has published data relating to the volume and value of hardship grants for the quarter. You need to go here (https://www.msd.govt.nz/about-msd-and-our-work/publications-resources/statistics/benefit/index.html) and look for ‘Work and Income regions supplementary assistance data tables’. You get a spreadsheet for the whole country, and you can find your region. The data is broken down by the reason for assistance (Food; Accommodation Related; Medical and Associated Costs; People Affected by Benefit Stand Downs; Electricity and Gas; School Education Costs; Re-establishment Grants; Driver Licence; Health Related; Other). In and of itself, this tells us what we are spending to meet these needs in addition to baseline benefits.
Alternatively, you can use the Social Development Data tool to look at ‘Hardship grants: Special Needs Grants; All Special Needs Grants/Adult (16 and over)’ for the Waikato by Month.
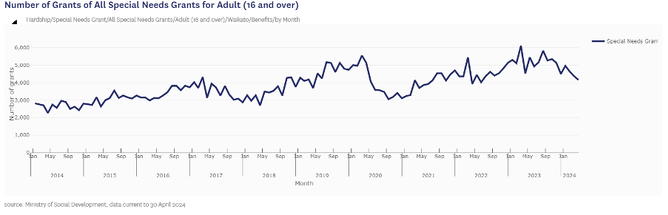
This goes back to 2014, but you can’t break it down into types of grant like you can on the spreadsheet.
Looking nationally over this time, we can see that need for food assistance has experienced an upwards trend over the past decade, with fewer than 33,642 food grants in January 2024 to 101,970 food grants in January 2024.
Like I said, taken alone, these are not perfect indications of anything. This might mean that it’s now much easier to get assistance than it was 10 years ago. It might mean that there are more funds available now than there were before. There it might mean that there’s increased awareness about the availability of this support. But whatever the reason, we can see that the number of grants is increasing.
Alongside our current data requests, the Waikato Wellbeing Project is working on a survey of regional indicators with the demographics unit, Te Ngira, at the University of Waikato. We are looking forward to sharing their findings with you in July.
Register you interest for the upcoming webinar by emailing amber@waikatowellbeingproject.com
The Waikato Wellbeing Project hosts Te Ara Poutama, a repository for wellbeing data and reports covering a range of Sustainable Development Goals at global, national, regional and sub-regional levels. This repository is growing, and data uncovered through this data request, as well as by our work with Te Ngira, can add to this resource also.
Data won’t feed anybody, but it can help us make sure our efforts are in the right direction, and add weight to our arguments, and support our celebrations.
Get voting!
