Sustainable Development Goals 4, 8 and 10

WWP TARGET:
Reduce (particularly for Māori and Pasifika) the number of young people (aged 15-24) in the Waikato who are not in employment, education or training (NEET) to less than 5% by 2030.
ACHIEVING OUR TARGET
MEANS THAT:
All our young people are engaged and productive, they are learning or earning a livelihood, their mana is enhanced, and they are on a positive pathway to have many life options. Our employers can find motivated staff with the knowledge and skill they need to get started, and the means to learn more.
Due to COVID-19, the proportion of the world’s youth not in education, employment or training (NEET) is now at its highest level since 2005. COVID-19 and now disruptions caused by the Ukraine War are affecting youth development worldwide. Many education measures are not consistently reported across different jurisdictions and timeframes.
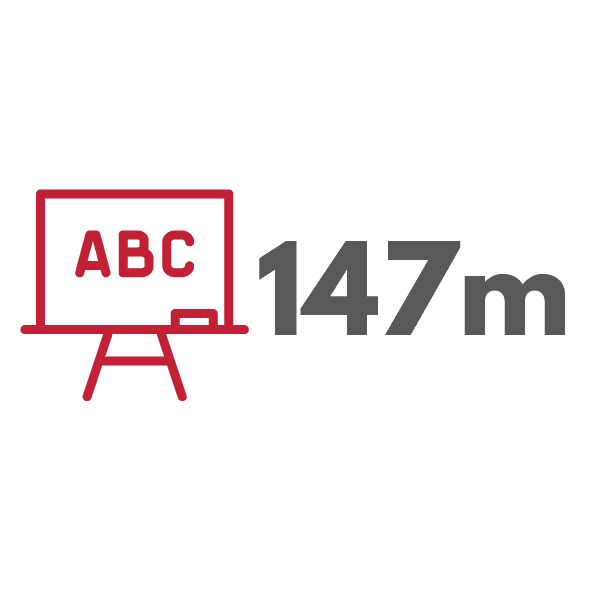
children missed more than half of their in-class
instruction over the past two years due to COVID-19


Combined estimated lost ($USD) lifetime earnings for children due to COVID restrictions and lockdowns
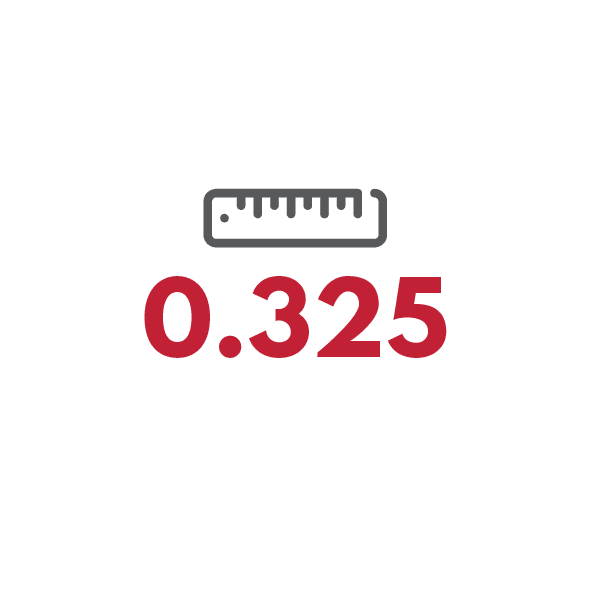
OECD income inequality in 2022, measured by the Gini
coefficient
The skill and qualification level of our adult population is strong, reflecting historically high levels of school achievement and immigration. There is a big gap between the highest-achieving and lowest-achieving students by OECD standards.
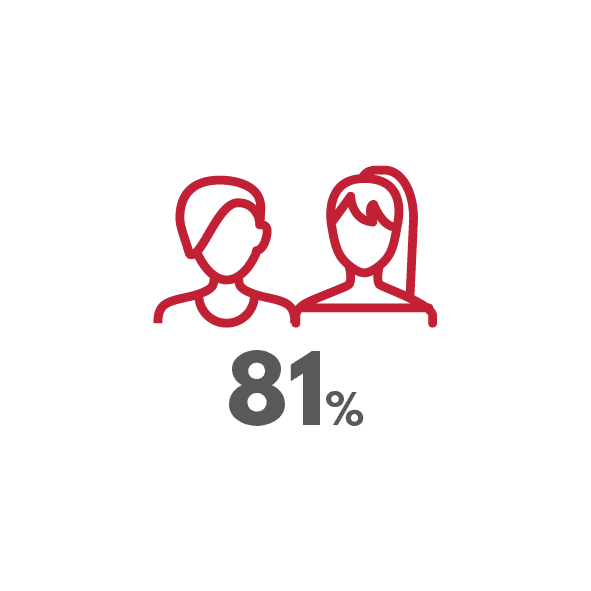
15 yr-olds in 2018 with basic reading literary skills (PISA)
2000 = 86%, OECD 2018 = 77%

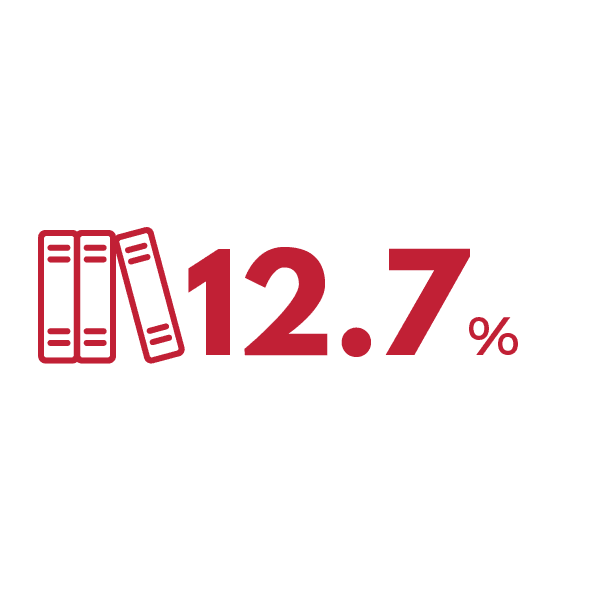
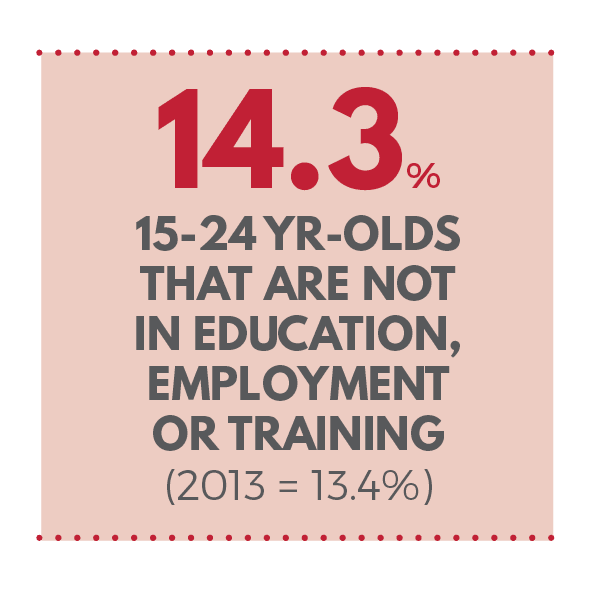
15-24 yr-olds that are not in Education, Employment or Training(2013 = 13.5%)

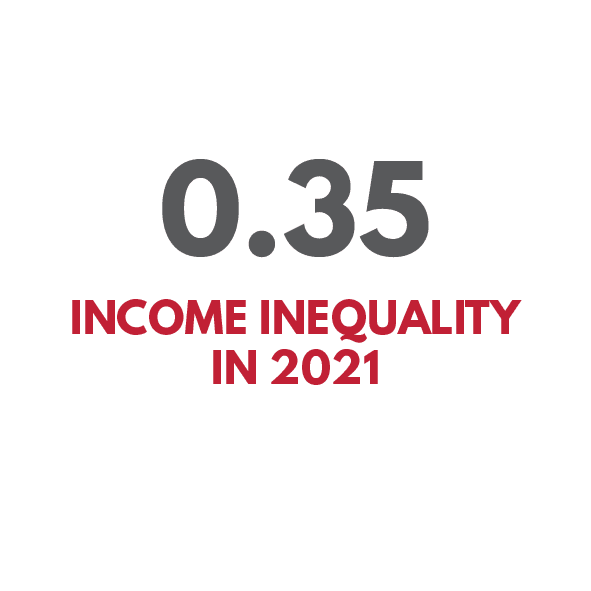
measured by the
Gini coefficient
The Waikato region tends to perform slightly lower on many education and employment measures than the New Zealand average.
This may reflect different socio-economic conditions, as is highlighted by the slightly higher NEET and Gini
co-efficient for the region.
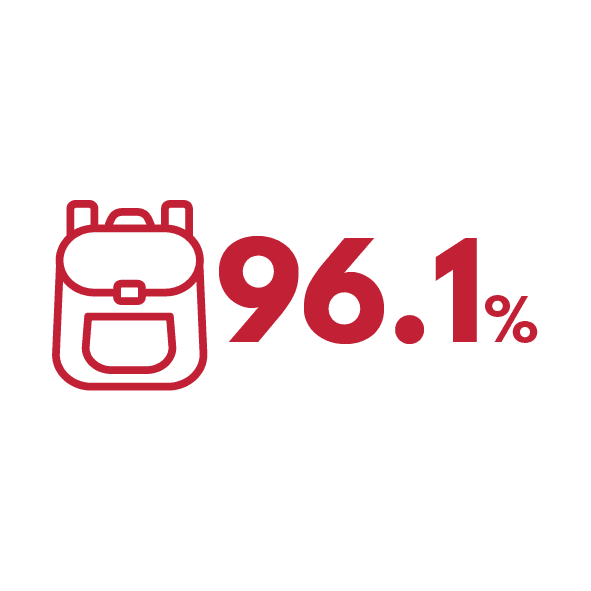
of children starting school who have
attended ECE (2021)

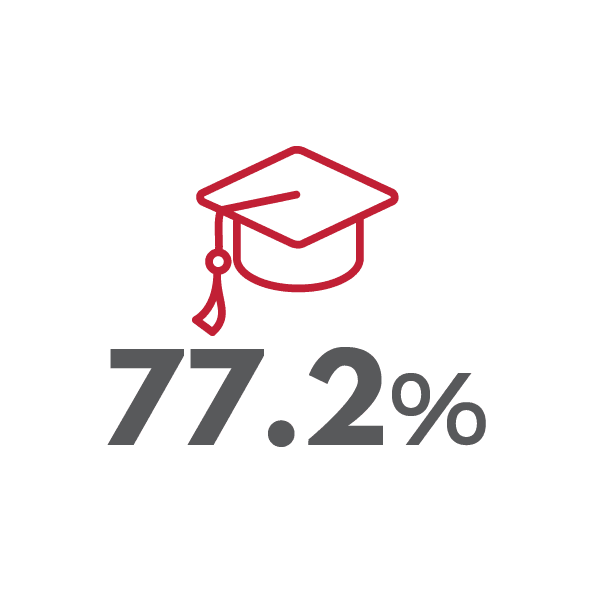
of Waikato school leavers with NCEA level 2 or above, compared to 64.2% in 2009
NZ = 78.2%
Income inequality
in 2021
measured by the Gini coefficient. Little change from 2007
RANGATAHI OPPORTUNITY PROJECT INSIGHTS (SDG 4 FOCUS)
Tell me more about this
i. An adequate description of the dataset
A high-level overview of key themes from relevant literature on rangatahi wellbeing in New Zealand.
ii. The source(s) of information
e Ngira | National Institute of Population Research:
iii. The date when the data was collected and the expected update frequency
November 2021
iv. Any use or publication restrictions, including cultural restrictions
None
v. A contact person or organisation
tengira@waikato.ac.nz
vi. Any quality/data health warnings
No
Tell me more about this
i. An adequate description of the dataset
In late 2021, the Waikato Wellbeing Project commissioned Te Ngira) to provide a demographic and socio-economic profile of rangatahi1 living in the Waikato region
ii. The source(s) of information
Te Ngira | National Institute of Population Research:
Socio-demograohicprofileofRangatahiintheWaikatoregionWaikatoWellbeingProject.2.1.pdf (rocketspark.co.nz)
iii. The date when the data was collected and the expected update frequency
February 2022
iv. Any use or publication restrictions, including cultural restrictions
None
v. A contact person or organisation
tengira@waikato.ac.nz
vi. Any quality/data health warnings
No
Tell me more about this
i. An adequate description of the dataset
In late 2021, the Waikato Wellbeing Project commissioned Te Ngira) to provide a demographic and socio-economic profile of rangatahi1 living in the Waikato region. This diagram provides a summary.
ii. The source(s) of information
Waikato Wellbeing Project
www.waikatowellbeingproject-zdbs-1.rocketspark.co.nz/site_files/36997/upload_files/Socio-demographicprofileofRangatahiintheWaikatoregion.1.1.pdf?dl=1
iii. The date when the data was collected and the expected update frequency
2022
iv. Any use or publication restrictions, including cultural restrictions
None
v. A contact person or organisation
www.waikatowellbeingproject.co.nz/contact/
vi. Any quality/data health warnings
No
Tell me more about this
i. An adequate description of the dataset
A research report which aims to understand the perspectives of rangatahi to identify the opportunities and actions we can take, within the Waikato to create opportunities for young people to be on a positive pathway to have many life options.
ii. The source(s) of information
Waikato Wellbeing Project:
www.waikatowellbeingproject-zdbs-1.rocketspark.co.nz/site_files/36997/upload_files/TheRangatahiOppourtunityDraftV6LR.1.pdf?dl=1
iii. The date when the data was collected and the expected update frequency
2022
iv. Any use or publication restrictions, including cultural restrictions
None
v. A contact person or organisation
www.waikatowellbeingproject.co.nz/contact/
vi. Any quality/data health warnings
No
ECONOMIC DEVELOPMENT INSIGHTS (SDG 8 FOCUS)
Tell me more about this
i. An adequate description of the dataset
This report presents Waikato regional and territorial local authority results from a survey undertaken in parallel with the 2022 Quality of Life Survey (a collaboration between nine New Zealand councils including Hamilton).
ii. The source(s) of information
Waikato Regional Council
https://www.waikatoregion.govt.nz/services/publications/tr202249/
iii. The date when the data was collected and the expected update frequency
November 2022
iv. Any use or publication restrictions, including cultural restrictions
None
v. A contact person or organisation
www.bps.waikatoregion.govt.nz/online-services/new/RequestForService/step/1?Subject=Policies,planningandstrategies
vi. Any quality/data health warnings
No
Tell me more about this
i. An adequate description of the dataset
A set of indicators which measure the Waikato region’s progress by identifying our current situation and trends across each of 32 key economic, environmental and social aspects.
ii. The source(s) of information
Waikato Progress Indicators:
https://public.tableau.com/app/profile/waikato.regional.council/viz/WaikatoProgressIndicatorsDashboard_16862300344780/INTRODUCTION
iii. The date when the data was collected and the expected update frequency
May 2023
iv. Any use or publication restrictions, including cultural restrictions
None
v. A contact person or organisation
www.bps.waikatoregion.govt.nz/online-services/new/RequestForService/step/1?Subject=Policies,planningandstrategies
vi. Any quality/data health warnings
No
Tell me more about this
i. An adequate description of the dataset
Key regional economic data that is updated regularly through the year. It includes data on sales and payments, labour market performance, social supports, and housing and construction. The dashboard allows you to view data for specific time periods, and for some charts district-level data is also available.
ii. The source(s) of information
Te Waka:
www.waikato.com/resources/data-and-insights
iii. The date when the data was collected and the expected update frequency
2023
Updated continuously
iv. Any use or publication restrictions, including cultural restrictions
None
v. A contact person or organisation
www.waikato.com/about/contact
vi. Any quality/data health warnings
No
Tell me more about this
i. An adequate description of the dataset
The Benefit Fact Sheets consist of:
An A4 snapshot, which highlights key points from the Benefit Fact Sheets, supporting the interpretation of the Tier One Statistics.
Ten Excel data files, containing information for:
National totals for main benefits, other benefits, New Zealand Superannuation (NZS), Veteran’s Pension (VP), selected supplementary and hardship assistance, number of dependent children, and number of non-beneficiaries (people who receive assistance from MSD that is not a main benefit). Recipient characteristics are shown for main benefits, and reasons for assistance are shown for hardship payments.
National totals of main benefit grants and cancellations, broken down by Work and Income region and recorded reason for cancelling main benefits.
Main benefits, broken down by Work and Income region and recipient characteristics.
Selected supplementary assistance and hardship payments (including reason for assistance), broken down by Work and Income region.
Main benefits, broken down by Regional Council area, benefit and recipient characteristics.
Main benefits, broken down by Auckland board area, benefit and recipient characteristics (for latest quarter only).
Main benefits, broken down by Territorial Authority area, benefit and recipient characteristics (for latest quarter only).
Main benefits, broken down by service centres and benefit (latest quarter only).
New Zealand Superannuation and Veteran’s Pension, broken down by key recipient characteristics. This file also contains information on receipt of pensions paid from overseas.
National totals of benefit sanctions arising from failure to meet work or youth activity obligations, broken down by Work and Income region, benefit, and type of sanction imposed.
ii. The source(s) of information
Ministry of Social Development
www.msd.govt.nz/about-msd-and-our-work/publications-resources/statistics/benefit/index.html#pTechnicalinformationp2
iii. The date when the data was collected and the expected update frequency
2023
Monthly
iv. Any use or publication restrictions, including cultural restrictions
None
v. A contact person or organisation
www.msd.govt.nz/about-msd-and-our-work/contact-us/index.html
vi. Any quality/data health warnings
No
Tell me more about this
i. An adequate description of the dataset
The goal of Education Counts is to increase the availability and accessibility of information about education statistics and research. Education Counts can be considered a 'one-stop shop' for such information, including:
demographic information, specifically tailored for use in the education sector
contextual information, such as labour market information, for assisting with the interpretation and understanding of education information
reference lists, including address and service details of New Zealand's education institutions
statistical information, various collections of statistical information obtained through Ministry of Education processes, including data on achievement, participation, and resourcing
analysis of education information, including education sector indicators and detailed examination of key education themes
publications, such as research and evaluation, Iterative Best Evidence Synthesis, regular monitoring reports, and specialised analysis pathways to other Ministry of Education, and Ministry sponsored, websites
technical info to support the use and interpretation of data and information, including data dictionaries, glossaries, and descriptions of analytical techniques.
ii. The source(s) of information
Ministry of Education
https://www.educationcounts.govt.nz/know-your-region/region/region-summary?region=3
iii. The date when the data was collected and the expected update frequency
2022
Annual
iv. Any use or publication restrictions, including cultural restrictions
None
v. A contact person or organisation
Requests.DataandInsights@education.govt.nz
vi. Any quality/data health warnings
No


